Power of Science — 3 Exhibits at Frost Museum
Three interactive exhibits for the Phillip and Patricia Frost Museum of Science in Miami, translating climate science into tactile, gamified public experiences across 6,000 sq ft of permanent gallery space. My work spanned UX research, 3D modeling, motion design, and UI systems across all three exhibits.
"Power of Science" permanent exhibition — Phillip and Patricia Frost Museum of Science, Miami.
The exhibition asked how climate science could move off wall panels and into visitors' hands and bodies. Each exhibit needed to carry real scientific content while remaining immediately playable for children, teenagers, and adults sharing the same floor.
Across the three exhibits, the design challenge was to make consequence visible — to show what happens when a hurricane makes landfall, when a coastline loses its barriers, or when a family waits too long to evacuate. Science communicated through action and outcome rather than text.
The project ran from November 2020 through April 2021, produced at Squint/Opera in collaboration with the museum's curatorial and education teams.
Three Exhibits
Each exhibit addressed a distinct phase of the hurricane experience — being inside the storm, defending the coast before it arrives, and making the decision to evacuate or stay. Together they formed a continuous narrative arc through the gallery.

Wild Weather AR
A Kinect-driven augmented reality experience that places visitors inside a simulated hurricane at three escalating intensity levels.

Build Your Own Coastline
A multiplayer touch-table game where up to three players make coastal infrastructure decisions balancing disaster protection, ecosystem health, and tourism.

Hurricane Hindsight
A dual-screen decision game that simulates a family's evacuation choices across three time windows as a hurricane approaches, scored against a real-time risk meter.
Exhibit I — Wild Weather AR
Visitors stand in front of a large projection screen. A Kinect sensor reads their body position and renders them inside a simulated Florida coastline environment. Motion activates the experience — standing still triggers an attractor animation; movement advances the storm intensity.
The storm progresses through three states: mild, medium, and severe. Each level introduces new atmospheric conditions — wind, rain, airborne debris, and storm surge rising from 2–4 ft to 10–14 ft. The environment is modeled on a residential coastline near Miami Beach, grounding the simulation in local geography and real hurricane data.

Environment iterations: calm baseline (left) and severe hurricane state (right).


Lighting and atmosphere explorations — testing different environmental tones before finalizing the storm progression palette.

Visitor in the exhibit — the AR composites their live Kinect-tracked silhouette into the storm environment in real time.
UI Overlay System
Layered over the environment, a UI system communicated storm conditions at each intensity level. Each screen displayed wind speed, surge height, and debris risk through color-coded graphics, keeping scientific content legible without interrupting the physical experience.


Three intensity-level UI overlays: mild, medium, and severe — each communicating wind speed, storm surge height, and storm type.

UX flow chart and interaction system mapping.

UX flow chart — attractor state, activation, and three-level storm progression.
Wild Weather AR — exhibit walkthrough.
Exhibit II — Build Your Own Coastline
A multiplayer touch-table game for up to three players. Each player is assigned a role — resident, developer, or conservationist — and must make a series of coastal infrastructure decisions over multiple rounds.
The scoring system balances three competing metrics: disaster resilience, ecosystem health, and tourism revenue. Players quickly discover that no single strategy optimizes all three simultaneously. The low-poly visual aesthetic was chosen specifically to appeal to younger audiences while remaining legible on a large horizontal display shared by multiple players simultaneously.

Visitors collaborating and competing at the "Build Your Own Coastline" touch table.
Structures & Characters
All 3D assets were modeled, textured, and animated in Cinema 4D to maintain a consistent low-poly language across residential buildings, commercial structures, coastal barriers, and nature elements. Each asset has an idle animation to keep the game world feeling alive between player actions.


Residential building asset library — five structural variants for player placement.
Coastal Barriers & Nature
Three barrier types — seawall, coral reef, and mangrove — offer different trade-offs between storm protection and ecological impact. Animated trees, beach chairs, and umbrellas populate the environment between player decisions, communicating the tourism dimension of coastal development.

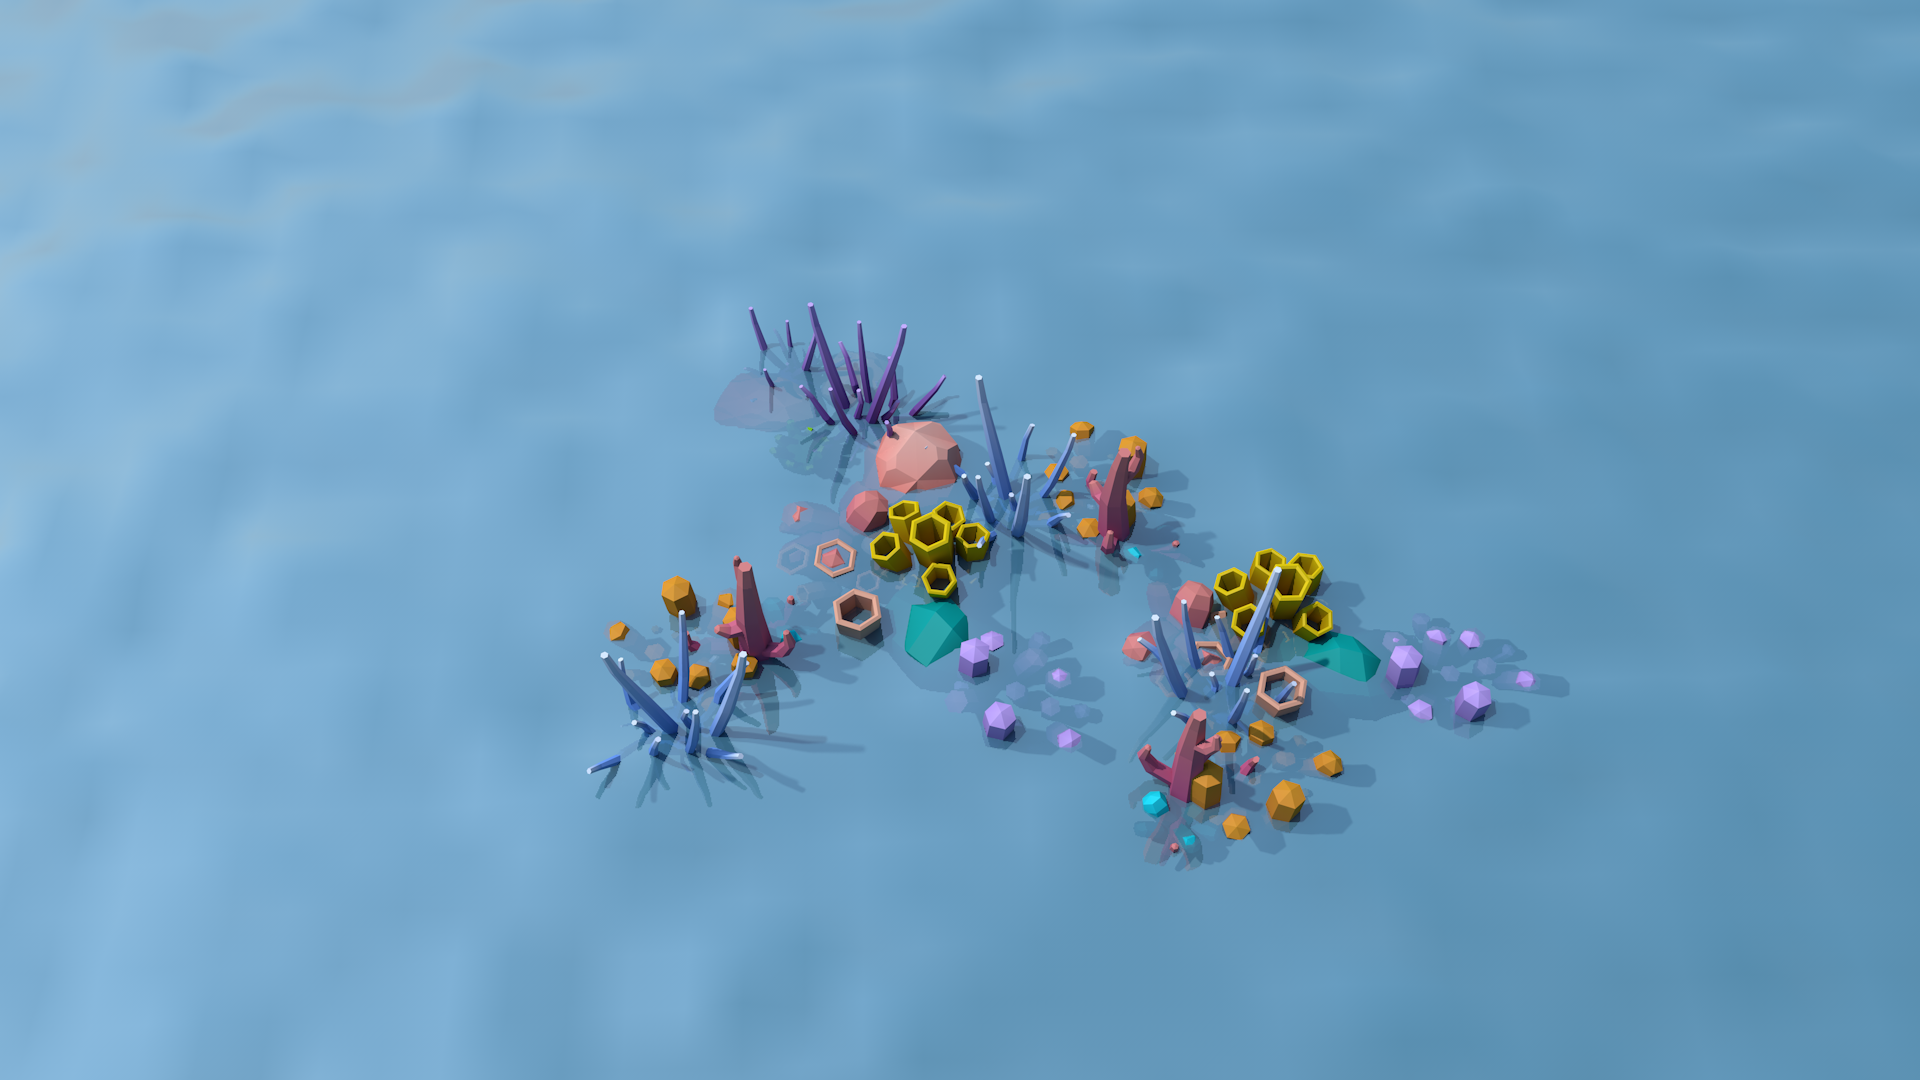


Full game environment — player-placed structures, coastal barriers, and nature assets composited on the touch-table display.

In-game screenshot showing multi-player layout and real-time consequence scoring.
Exhibit III — Hurricane Hindsight
The third exhibit confronts visitors with a problem that feels abstract until it happens: when should a family evacuate, and who should they trust to tell them?
Players receive information through four simulated channels simultaneously — TV news and track maps, social media posts, a weather app, and text messages from family members. Each source has different reliability, update frequency, and emotional weight. The game presents three decision points: 5 days out, 3 days out, and 36 hours before landfall.
A "risk-o-meter" scores each decision in real time, while a countdown timer creates the same time pressure that real evacuation decisions carry. Players who wait too long for certainty often discover they waited too long to leave.
TV News & Track Maps


TV news track map progression — 5 days out (wide uncertainty cone), 3 days out, and 36 hours before landfall (high confidence, narrow path).
Text Messages


Simulated text message thread — family communication escalating from uncertainty to urgency as the storm approaches.
Weather App


Weather app screens at each decision window — data clarity increases as the storm approaches, but so does the cost of waiting.
Social Media


Simulated social media feed — the least reliable source, designed to model how misinformation and noise compound decision-making under pressure.
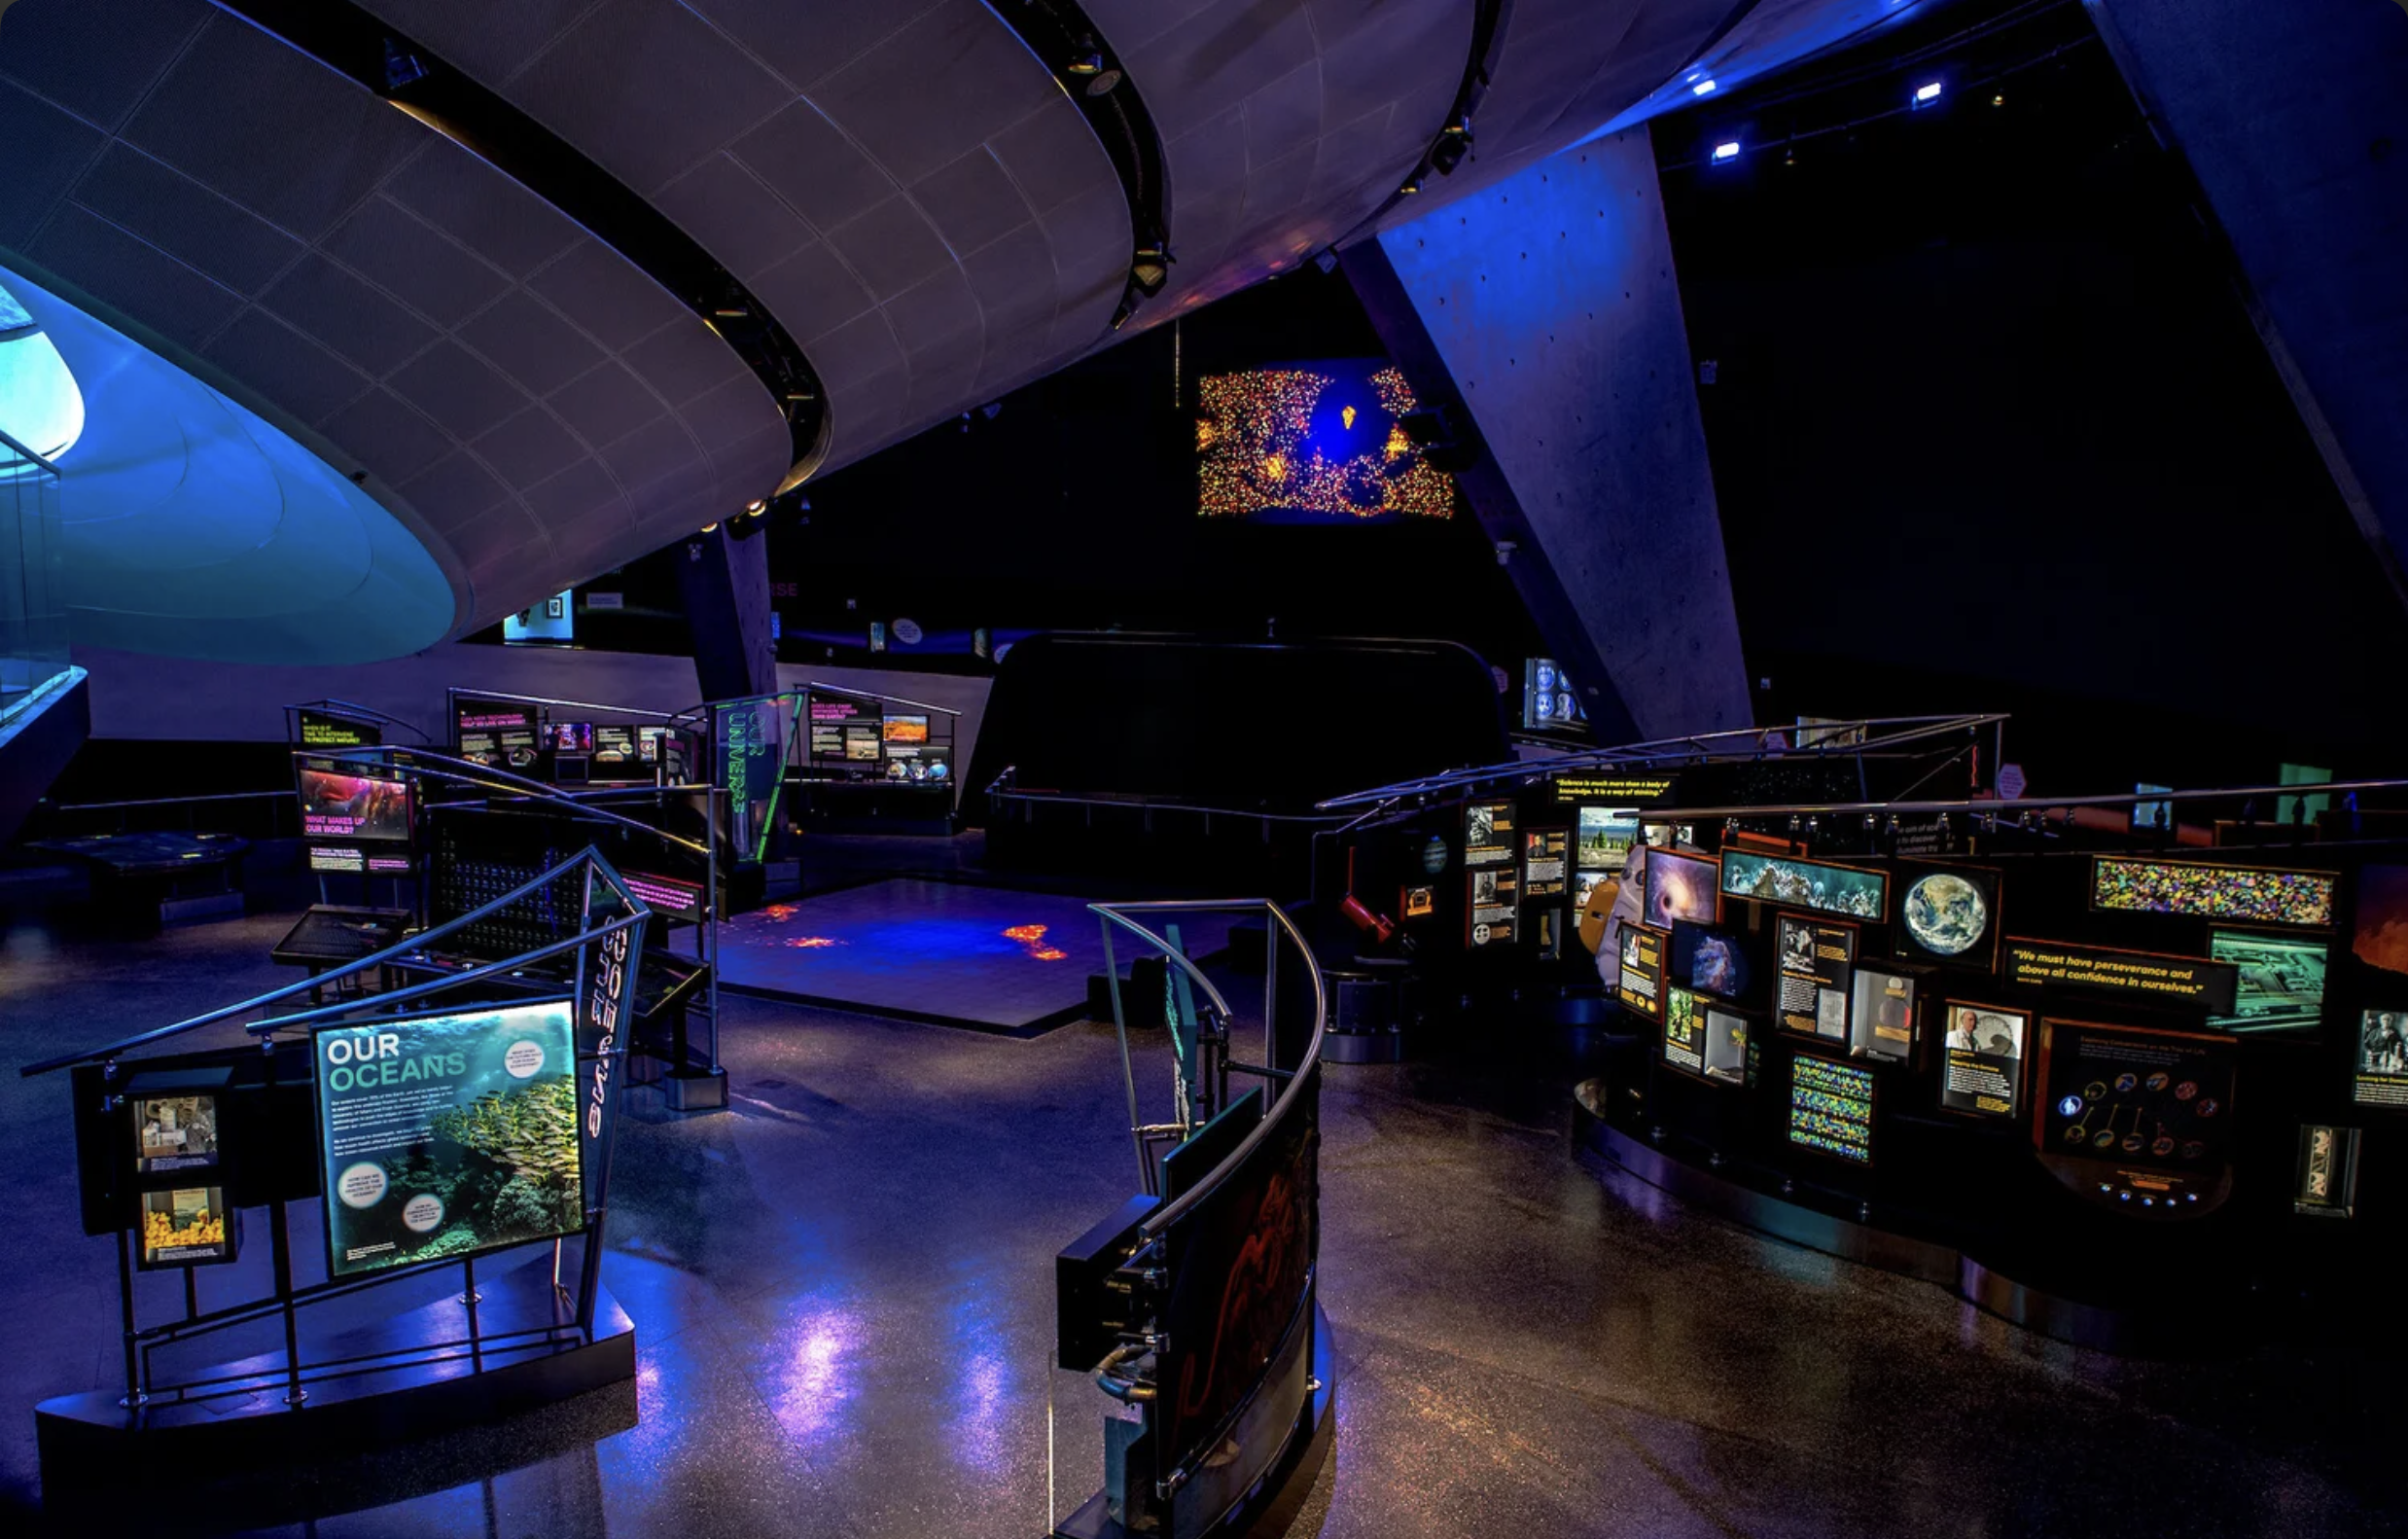
In the Museum
The three exhibits opened as permanent installations within the Frost Museum's 6,000 sq ft "Power of Science" gallery in April 2021. The physical environment was designed to transition visitors naturally between the kinetic AR experience, the collaborative table, and the decision simulation without scripted guidance.


Gallery installation and museum environment.
Outcome
The three exhibits demonstrated that scientific content doesn't require visitors to read to engage with it. By giving people agency — over the storm, the coastline, or the evacuation clock — the exhibition made the stakes of climate decisions legible through action rather than explanation.
The low-poly asset library and shared motion language across all three experiences created cohesion across the gallery, while the distinct interactive formats ensured each exhibit worked independently for visitors who engaged with only one.
Next project